Disclaimer: This article reflects my perspective and experience as a Data Analyst. Every organization has unique requirements, budgets, and operational challenges. The concepts discussed here should be considered as professional observations rather than universal recommendations. Businesses should evaluate their own circumstances before making technology decisions.
The Business Problem: Why Reporting Gets More Difficult as Businesses Grow
 One of the most common conversations I have with business owners and organizational leaders starts with a reporting challenge. Reports take too long to create, require significant manual effort, and often produce inconsistent results.
In many cases, the problem isn’t the report itself. Information is spread across multiple spreadsheets, folders, and business systems, requiring someone to manually gather, combine, and validate the data before a report can be produced.
As businesses grow, leaders often begin asking questions such as:
- Why are there multiple versions of the same spreadsheet?
- Why do reports show different numbers?
- Why does reporting take so long?
- Why can’t our reports update automatically?
- Why can’t we easily combine information from different systems?
While these may appear to be reporting problems, they are often symptoms of a larger challenge: how information is stored, managed, and connected across the organization.
Why Information Architecture Matters
Most business leaders focus on the reports and dashboards they use to monitor performance. What is often overlooked is the foundation behind them. Every report, dashboard, and KPI depends on how information is collected, organized, stored, and maintained across the organization.
A useful way to think about data is to compare it to inventory. When inventory is disorganized, employees spend more time searching for products, correcting errors, and locating missing items than serving customers. The same principle applies to business information. When data is scattered across spreadsheets, folders, software platforms, and disconnected systems, teams spend more time gathering information than analyzing it.
This challenge is particularly common in sales and marketing operations, where leaders need timely access to information in order to make informed decisions. For example, an e-commerce business may need visibility into:
- Daily revenue performance
- Website traffic trends
- Advertising results
- Customer acquisition costs
- Product sales performance
- Conversion rates
While these metrics may be available, they are often spread across multiple reports and systems. As the number of data sources increases, creating a complete and accurate picture of business performance becomes more difficult and time-consuming.
This is why information architecture matters. The goal is not simply to create reports or build dashboards. The goal is to organize information in a way that supports accurate reporting, improves operational efficiency, and enables better decision-making throughout the organization.
Understanding the Difference Between File Storage and Data Storage
Once organizations begin looking for ways to improve reporting and decision-making, they often encounter an important distinction: file storage and data storage. Although the terms are sometimes used interchangeably, they serve very different purposes and play different roles within an organization’s information architecture.
What Is File Storage?
File storage is designed to store documents.
Examples include:
- Microsoft OneDrive
- SharePoint Document Libraries
- Network Drives
- Google Drive
- Dropbox
These systems are excellent for:
- Storing files
- Sharing documents
- Collaborating on content
- Version control
- Document management
Examples of files include:
- Excel workbooks
- Word documents
- PowerPoint presentations
- PDFs
- Images
- Videos
The primary purpose is managing documents.
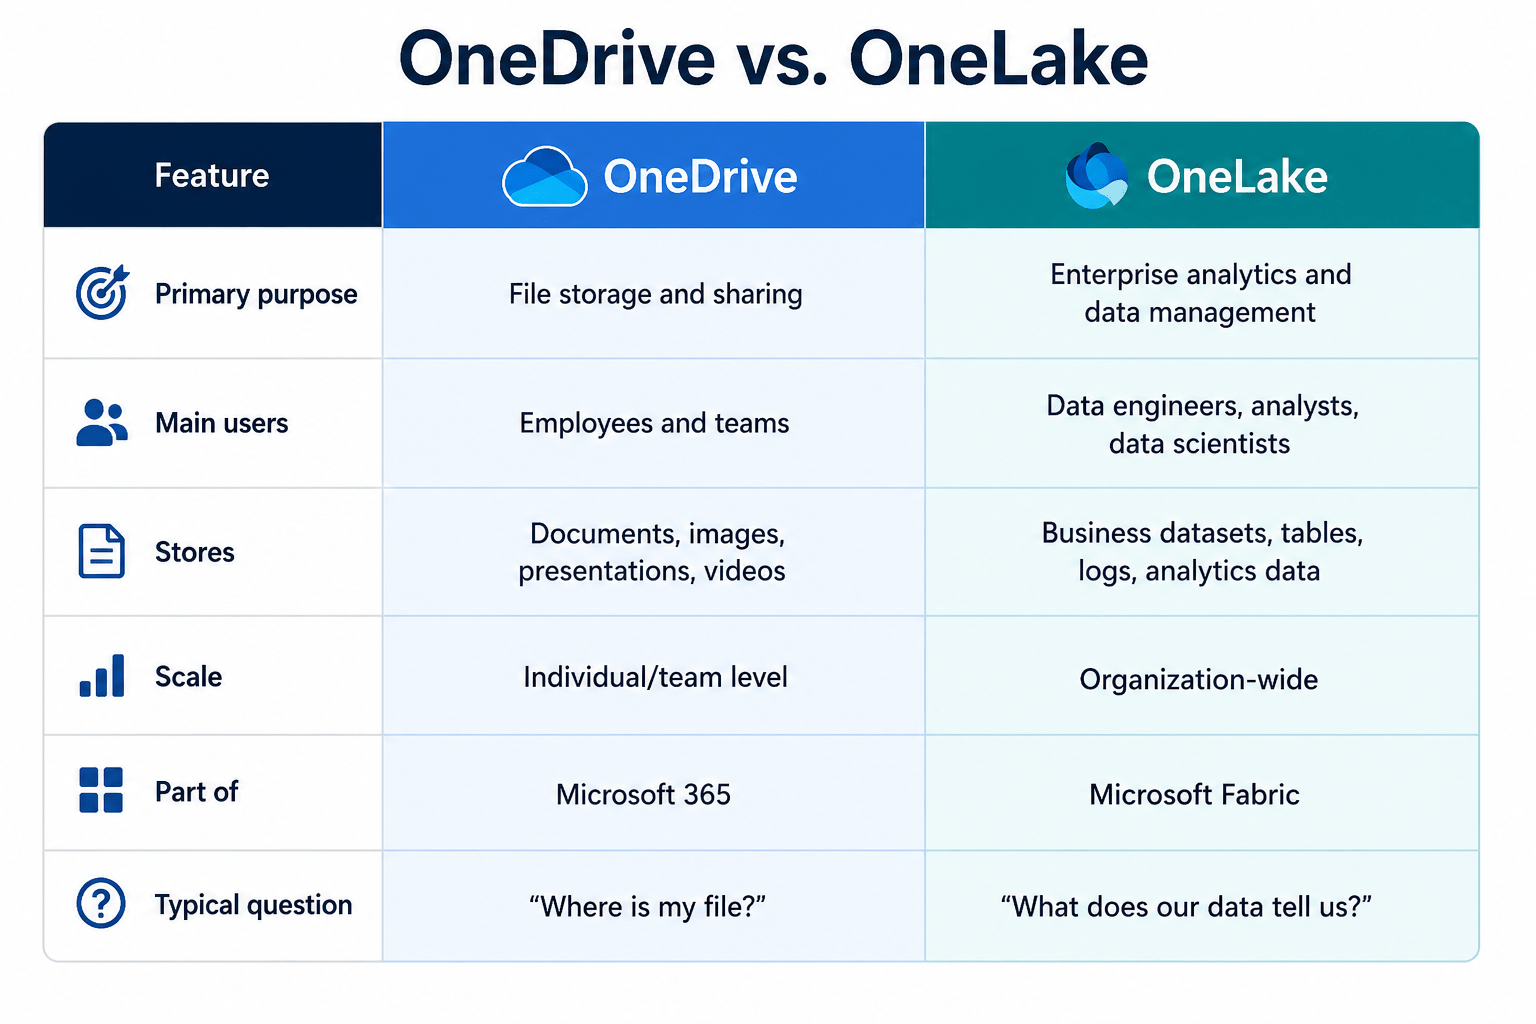
What Is Data Storage?
Data storage is designed to store records.
Examples include:
- Databases
- Data Warehouses
- Microsoft Fabric
- OneLake
- SQL Servers
These systems are designed for:
- Storing structured information
- Connecting multiple systems
- Retrieving records efficiently
- Supporting reporting and analytics
- Maintaining a single source of truth
The primary purpose is managing information.
Documents contain information.
Data storage organizes information for analysis and decision-making.
While understanding the difference is important, many organizations don’t realize they have crossed this boundary until their spreadsheets become critical to daily operations.
When Excel Becomes a Business System
Excel is one of the most powerful and widely used business tools available. Many organizations rely on it to manage:
- Sales tracking
- Inventory management
- Customer records
- Project management
- Financial reporting
For small teams and straightforward processes, Excel is often the right solution. It is familiar, flexible, and cost-effective.
The challenge begins when spreadsheets become the foundation of critical business operations. As organizations grow, more worksheets are added, new workbooks are created, data is imported from other systems, and reports are built from multiple sources. What started as a simple spreadsheet gradually becomes the system everyone relies on to access information and make decisions.
At that point, Excel is no longer just a spreadsheet. It has become a business system.
This does not mean Excel is the wrong tool. In many cases, it continues to serve organizations extremely well. However, when reporting requires data from multiple sources, real-time visibility becomes important, or maintaining spreadsheets consumes significant time and effort, it may be worth considering a more centralized approach to managing information.
The question is not whether Excel is good or bad. The more important question is whether Excel is still the right tool for the complexity of the business.
Reports vs Dashboards: Why the Difference Matters
As organizations improve how they manage data, another point of confusion often emerges: the difference between reports and dashboards. While they may contain similar information and are often used together, they serve different purposes and help answer different business questions.
Reports
Reports help answer specific questions.
Examples include:
- Monthly sales reports
- Quarterly financial reports
- Marketing performance reports
- Inventory summaries
Reports typically focus on what happened.
Dashboards
Dashboards help monitor business performance.
Examples include:
- Live sales dashboards
- Website analytics dashboards
- Marketing campaign dashboards
- Executive KPI dashboards
Dashboards focus on what is happening now.
A simple way to remember the difference is that reports explain what happened, while dashboards help monitor what is happening.
Regardless of the format, both depend on accurate, accessible data. Once organizations recognize the importance of better information management, the next question often becomes: what tools can help support that goal?
How Microsoft 365 and Fabric Fit Into the Conversation
Once organizations recognize the importance of better information management, the next question often becomes: what tools can help support that goal?
Many businesses already use Microsoft 365 without realizing they have access to tools that can help organize information, improve collaboration, and support reporting. Applications such as Teams, SharePoint, OneDrive, Excel, and Outlook are designed to help employees create, store, share, and manage content throughout the organization.
- Teams
- SharePoint
- OneDrive
- Excel
- Outlook
Together, these tools provide a solid foundation for document management and collaboration.

As reporting requirements become more sophisticated, organizations often need additional capabilities to connect data from multiple systems, automate reporting processes, and provide greater visibility into business performance. This is where Microsoft Fabric enters the conversation.
Microsoft Fabric extends the Microsoft ecosystem by helping organizations centralize and manage their data for reporting and analytics. It can be used to consolidate information from multiple sources, build automated reporting solutions, create Power BI dashboards, and support more advanced analytics initiatives.
Key capabilities include:
- Consolidating information from multiple systems
- Storing centralized data
- Building automated reporting solutions
- Creating dashboards using Power BI
- Supporting advanced analytics and AI initiatives
Rather than collecting information from numerous spreadsheets and disconnected systems, organizations can work from a centralized data foundation that supports more efficient reporting and decision-making.

A Practical Framework for Business Leaders
When evaluating reporting and data requirements, I encourage business leaders to think about technology as a journey rather than a destination. Not every organization needs advanced analytics platforms or enterprise-scale solutions. The right approach depends on the complexity of the business, the volume of information being managed, and the reporting requirements of the organization.
Stage 1: File-Based Operations
This stage is often appropriate for smaller organizations with straightforward processes and limited reporting requirements.
Best suited for:
- Small teams
- Limited reporting requirements
- Simple processes
Typical tools:
- Excel
- OneDrive
- SharePoint
Stage 2: Structured Reporting
As organizations grow, reporting requirements become more frequent and information often needs to be shared across departments. At this stage, businesses typically benefit from more structured reporting processes and centralized information sources.
Best suited for:
- Growing organizations
- Multiple departments
- Recurring reports
Typical tools:
- Power BI
- SharePoint Lists
- Databases
Stage 3: Centralized Data Management
Organizations operating multiple systems often reach a point where information needs to be consolidated and managed from a central location. This allows for automated reporting, improved data quality, and broader business visibility.
Best suited for:
- Multiple systems
- Automated reporting
- Cross-functional analysis
Typical tools:
- Data Warehouses
- Fabric
- OneLake
Stage 4: Enterprise Analytics
At the highest level of maturity, organizations focus on predictive insights, advanced analytics, and AI-driven decision-making.
Best suited for:
- Advanced reporting
- Predictive analytics
- AI initiatives
- Enterprise-scale operations
Typical tools:
- Microsoft Fabric
- Power BI
- Machine Learning Solutions
The objective is not to adopt the most advanced technology available. The objective is to adopt the right technology for your business needs today while creating a foundation that can support future growth.

The People Behind the Technology
Technology alone does not solve information challenges. Even the most advanced reporting and analytics platforms still require people who understand how information should be collected, managed, analyzed, and maintained.
In my experience, organizations eventually need two key capabilities to support effective reporting and decision-making.
IT or Data Engineering Support
This role focuses on building and maintaining the technical foundation that supports reporting and analytics. Responsibilities typically include:
- Infrastructure
- Security
- Integrations
- Data pipelines
- System maintenance
Depending on the size of the organization, this capability may be provided by an internal IT team, a dedicated data engineer, or an outsourced technology partner.
Data Analysis Support
While technical teams focus on the infrastructure, data analysts focus on turning information into business value. Their responsibilities often include:
- Reporting
- Dashboards
- Business analysis
- Data interpretation
- Decision support
Technology can help organizations collect and organize information, but people are ultimately responsible for transforming that information into actionable insights that support better decision-making.
Final Thoughts
As a Data Analyst, I’ve found that many organizations think they have a reporting problem when the real challenge is how their information is stored, managed, and connected.
Excel remains one of the most valuable business tools available and, for many organizations, it may be all they need. However, as businesses grow and reporting becomes more complex, it’s important to evaluate whether spreadsheets are still supporting the organization’s needs or whether a more centralized approach would provide greater efficiency and visibility.
The goal isn’t to adopt the latest technology. The goal is to ensure your information is organized, accessible, and reliable enough to support better business decisions.
A spreadsheet stops being just a spreadsheet when it becomes the system everyone depends on to run the business.
Let’s Connect
If you’re trying to determine whether your organization needs better reporting, centralized data management, dashboards, or simply a clearer understanding of the options available, I’d be happy to have a friendly conversation.
Every business is different, and sometimes the best starting point is simply understanding the problem before investing in a solution.
Feel free to reach out and connect. I’d enjoy hearing about your challenges, sharing my perspective as a Data Analyst, and exploring what might make sense for your organization.